Painting is the most labor-heavy job priced anywhere on this site. About 78 cents of every dollar is somebody's time — paint costs the same in Boise as it does in Boston, and the brush does not.
That makes state lines matter more here than in any other trade, and it makes this table worth building properly instead of guessing at bands.
How the numbers were built
The national price. A full interior repaint — walls and ceilings, two coats, minor patching, masking — runs about $3.20 per ft² of floor area in 2026, inside a market range of roughly $2.00 to $6.00.
The labor share. 78%. The remaining 22% is paint, primer, tape, plastic and sundries, bought at national prices.
Only the labor portion is scaled, and it is scaled by one published number: the BLS mean annual wage for painters, construction and maintenance in that state, against the U.S. mean of $55,420. That is the OEWS release for May 2025, SOC 47-2141. Every row below can be checked against the BLS site.
All 51 states, a 2,000 sq ft home
Each state links to a page where you can set your own square footage.
| State | Painters mean pay | Labor factor | Typical total | Bid range |
|---|---|---|---|---|
| Alabama | $44,720 | 0.807 | $5,436 | $3,398 – $10,193 |
| Alaska | $64,220 | 1.159 | $7,193 | $4,495 – $13,486 |
| Arizona | $52,480 | 0.947 | $6,135 | $3,834 – $11,503 |
| Arkansas | $42,180 | 0.761 | $5,207 | $3,255 – $9,764 |
| California | $62,460 | 1.127 | $7,034 | $4,396 – $13,189 |
| Colorado | $56,370 | 1.017 | $6,486 | $4,053 – $12,160 |
| Connecticut | $63,500 | 1.146 | $7,128 | $4,455 – $13,365 |
| Delaware | $56,890 | 1.027 | $6,532 | $4,083 – $12,248 |
| District of Columbia | $62,240 | 1.123 | $7,014 | $4,384 – $13,152 |
| Florida | $48,440 | 0.874 | $5,771 | $3,607 – $10,821 |
| Georgia | $50,550 | 0.912 | $5,961 | $3,726 – $11,177 |
| Hawaii | $71,310 | 1.287 | $7,831 | $4,895 – $14,684 |
| Idaho | $45,490 | 0.821 | $5,506 | $3,441 – $10,323 |
| Illinois | $69,630 | 1.256 | $7,680 | $4,800 – $14,400 |
| Indiana | $53,000 | 0.956 | $6,182 | $3,864 – $11,591 |
| Iowa | $52,070 | 0.94 | $6,098 | $3,811 – $11,434 |
| Kansas | $45,450 | 0.82 | $5,502 | $3,439 – $10,316 |
| Kentucky | $51,420 | 0.928 | $6,040 | $3,775 – $11,324 |
| Louisiana | $46,030 | 0.831 | $5,554 | $3,471 – $10,414 |
| Maine | $60,230 | 1.087 | $6,833 | $4,271 – $12,812 |
| Maryland | $55,650 | 1.004 | $6,421 | $4,013 – $12,039 |
| Massachusetts | $64,080 | 1.156 | $7,180 | $4,488 – $13,463 |
| Michigan | $55,920 | 1.009 | $6,445 | $4,028 – $12,084 |
| Minnesota | $58,170 | 1.05 | $6,648 | $4,155 – $12,464 |
| Mississippi | $46,450 | 0.838 | $5,592 | $3,495 – $10,485 |
| Missouri | $59,450 | 1.073 | $6,763 | $4,227 – $12,681 |
| Montana | $54,700 | 0.987 | $6,335 | $3,959 – $11,878 |
| Nebraska | $46,590 | 0.841 | $5,605 | $3,503 – $10,509 |
| Nevada | $59,610 | 1.076 | $6,777 | $4,236 – $12,708 |
| New Hampshire | $52,730 | 0.951 | $6,158 | $3,849 – $11,546 |
| New Jersey | $61,000 | 1.101 | $6,903 | $4,314 – $12,942 |
| New Mexico | $49,380 | 0.891 | $5,856 | $3,660 – $10,980 |
| New York | $68,070 | 1.228 | $7,539 | $4,712 – $14,136 |
| North Carolina | $44,900 | 0.81 | $5,452 | $3,408 – $10,223 |
| North Dakota | $55,960 | 1.01 | $6,449 | $4,030 – $12,091 |
| Ohio | $54,510 | 0.984 | $6,318 | $3,949 – $11,846 |
| Oklahoma | $45,450 | 0.82 | $5,502 | $3,439 – $10,316 |
| Oregon | $53,570 | 0.967 | $6,233 | $3,896 – $11,688 |
| Pennsylvania | $54,230 | 0.979 | $6,293 | $3,933 – $11,799 |
| Rhode Island | $48,150 | 0.869 | $5,745 | $3,591 – $10,772 |
| South Carolina | $42,050 | 0.759 | $5,196 | $3,247 – $9,742 |
| South Dakota | $47,710 | 0.861 | $5,706 | $3,566 – $10,698 |
| Tennessee | $44,590 | 0.805 | $5,424 | $3,390 – $10,171 |
| Texas | $46,020 | 0.83 | $5,553 | $3,471 – $10,412 |
| Utah | $47,690 | 0.861 | $5,704 | $3,565 – $10,694 |
| Vermont | $54,890 | 0.99 | $6,352 | $3,970 – $11,910 |
| Virginia | $49,110 | 0.886 | $5,832 | $3,645 – $10,934 |
| Washington | $60,910 | 1.099 | $6,895 | $4,309 – $12,927 |
| West Virginia | $44,770 | 0.808 | $5,441 | $3,400 – $10,201 |
| Wisconsin | $54,170 | 0.977 | $6,287 | $3,930 – $11,789 |
| Wyoming | $47,620 | 0.859 | $5,697 | $3,561 – $10,683 |
What the spread actually says
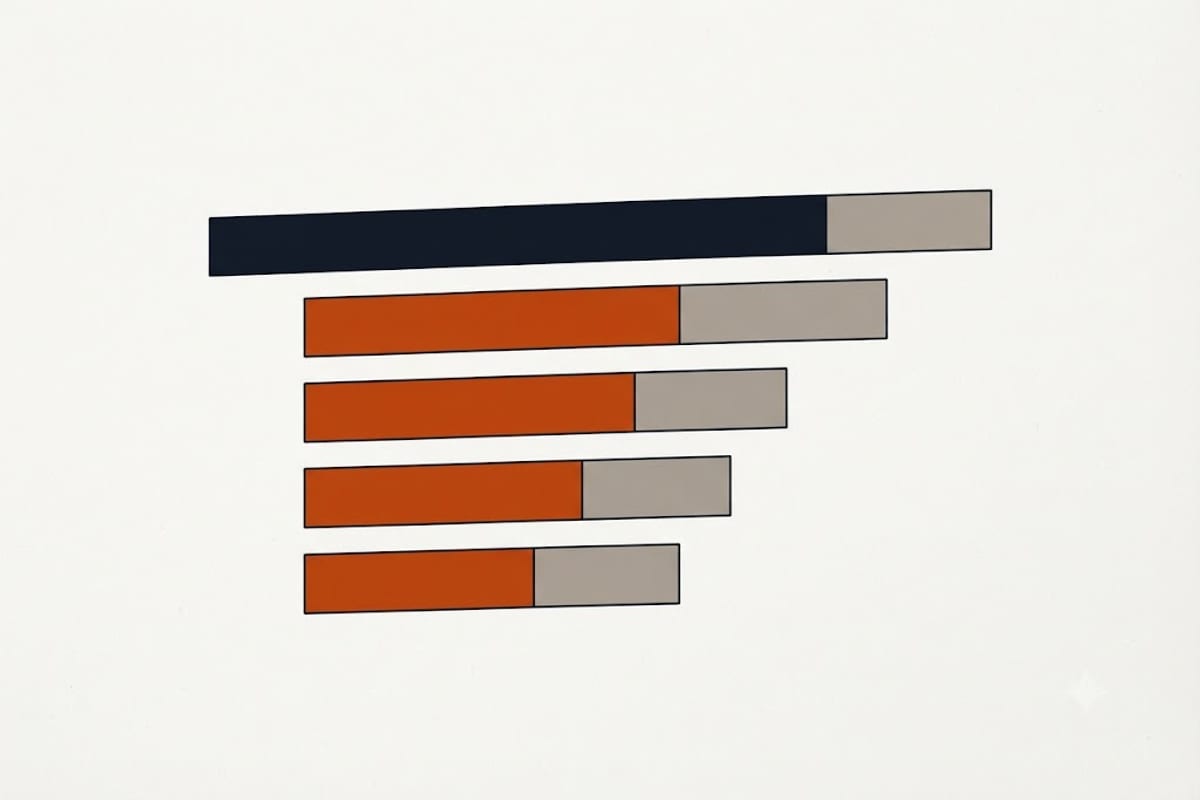
1.51× top to bottom — Hawaii at $7,831 against South Carolina at $5,196. That is the widest spread of any trade priced on these sites, and it is wide for exactly the reason above: when 78% of a job is labor, the labor market shows through.
Compare it to insulation, where labor is 45% and the same exercise compresses to 1.35×. The percentage of a job that is hours is a better predictor of how much geography matters than any regional cost index.
Two things to notice in the ordering. Hawaii and Alaska are at the top for the obvious reason. But Illinois and New York sit above California, which surprises people — painter wages in Chicago and New York are union-anchored in a way California's are not, statewide.
What this table cannot see
Trim is not in it. Walls and ceilings are area work and scale predictably. Doors, windows, baseboards and crown are linear-foot work, they are slow, and most crews price them separately — often a third again on top of the number above. A quote that looks cheap is frequently a walls-only quote.
Ceiling height. The price above assumes 8-foot ceilings. Nine or ten feet adds wall area that floor area does not reveal, and a two-story entry or a stairwell adds staging, which is priced by the hour and not by the square foot.
Condition. Wallpaper removal, water stains needing stain-blocking primer, and drywall repair past nail holes are all separate lines. See do I need primer before painting for when the primer line is real and when it is padding.
The gap between two bids is usually coats, not greed
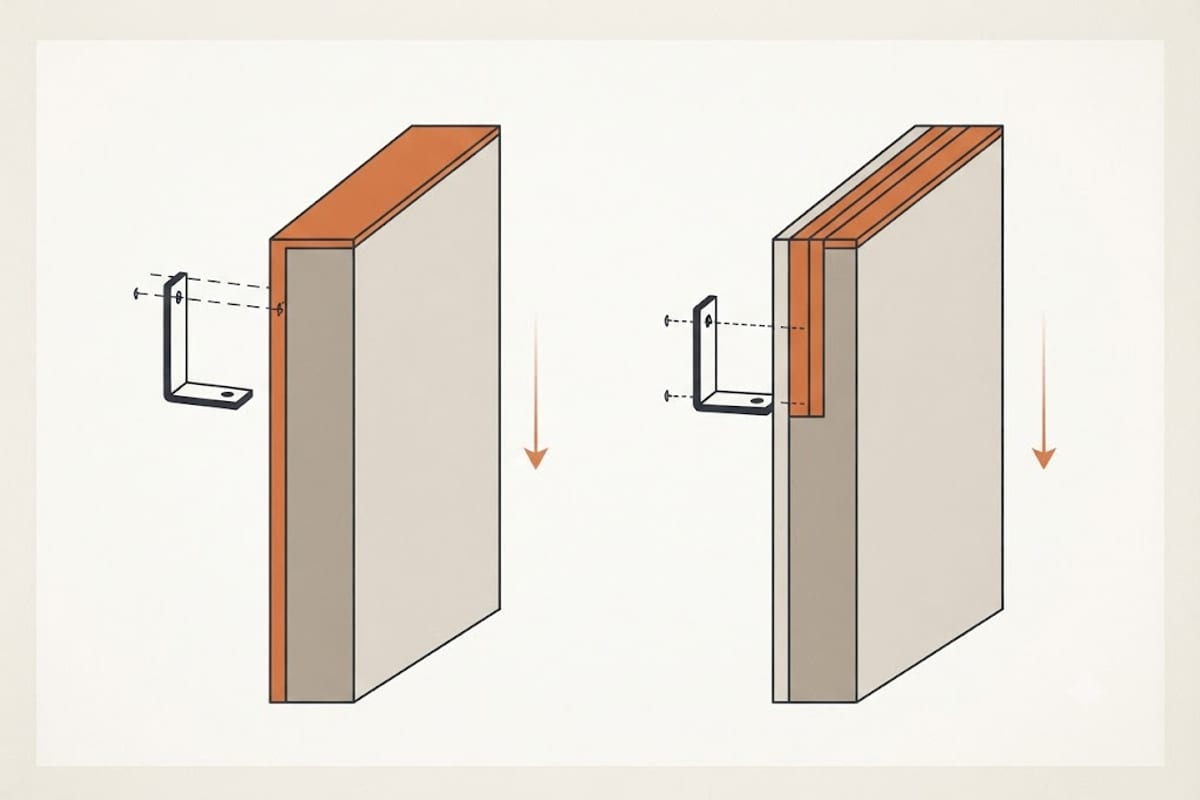
When two quotes on the same house differ by a third, the difference is almost always one of three things, and none of them is the painter's margin:
- Number of coats. One coat over a color change looks correct on the day and patchy in six months of side light.
- Ceilings in or out. Ceilings are roughly a third of the paintable area in a typical room and they are the slowest part to cut in.
- Prep depth. Filling and sanding every nail pop takes hours that do not show up on the finished wall — which is precisely why it is the first thing dropped to win a bid.
Ask all three questions before comparing totals. See how much paint do I need for a room to check whether the material quantity in a bid is even plausible.
How to use this
Open your state's page above, set your actual square footage, and treat the bid range as a plausibility band. A quote under it is usually a narrower scope, not a better price — read the exclusions first.